|
Croker-Rhyne Co., Inc. |
|
Main Page |
Philosophy | Current
Recommendations |
Newsletter Archives Contact Us
|
|
|
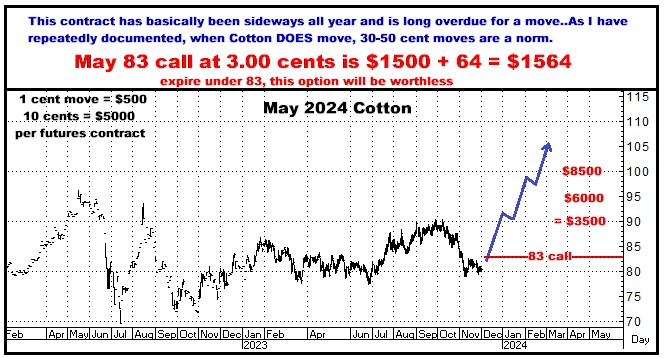
December 1, 2023 The stock market represents an interpretation of the future economy, and NOT that of the present. And as such, many markets that are directly impacted by the economy certainly may take clues from what Dow HAS been doing...that is, they can be influenced up or down by what Stocks are “telling them” about future strength or weakness in the economy. On the chart following, which tracks the Dow vs Cotton, WHAT JUMPS OFF THE CHART is that the two markets appear to have been moving fairly identically for the past 18 months…except for one thing…I have adjusted the charts such that Cotton is actually shown here with a one month time lag to the Dow…In other words, with these two charts having been almost identical , what it means is: Whatever the Dow has done, Cotton has generally done the same thing a month later.
This chart IS one of the reasons I have referred to Cotton as a proxy for the Stock Market…And though the relationship may change, WITH THE DOW HAVING JUST RALLIED SHARPLY DURING THE PAST MONTH…out of nowhere really…I NOW LOOK FOR COTTON TO DO THE SAME. I continue to look for stocks and the economy to do nothing but strengthen…And I continue to strongly recommend buying Cotton, still looking for a move up to at least the $1.10 area within the next 3-6 months.
Updating other recommendations… STILL LONG THE STOCK INDICES
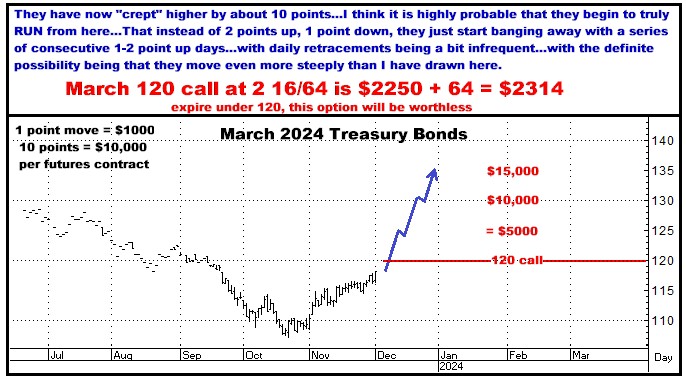
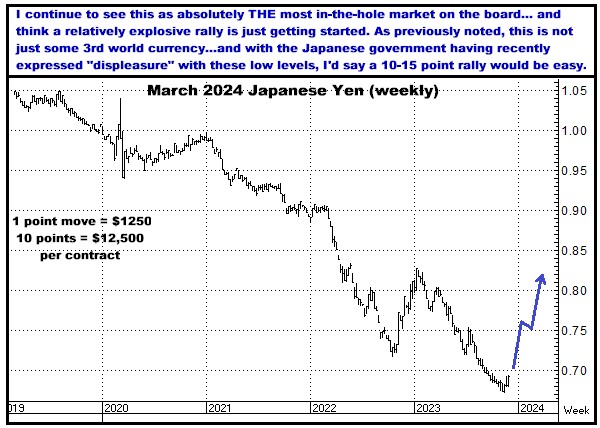
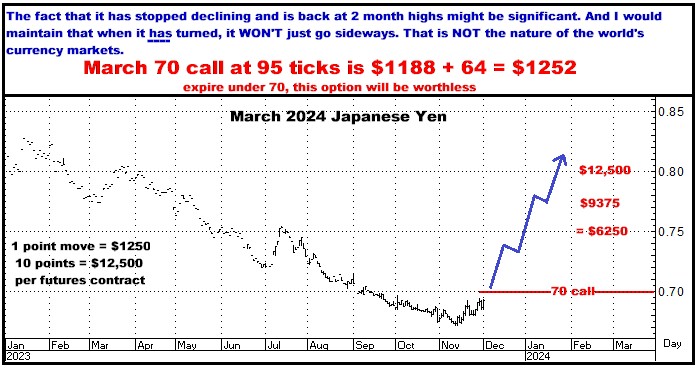
Several years ago, Wall Street, and especially the Fed, TOTALLY misread the steep rise in inflation until long after it had blasted to 40 year highs...And now? I think their next big miss is going to be not realizing how sharply lower the inflation rate may be headed...into negative levels even...suggesting DEFLATION. I'm not supposing it would be long lasting...just an overshoot as we return to normal... But let me tell you: If/when we get a just a whiff of a negative CPI, by the time that happens, there's no telling how high the Bond market might already be! I continue to recommend BUYING BONDS. STILL LONG THE JAPANESE YEN
STILL SHORT COCOA NOW BUYING WHEAT STILL SHORTING SOYBEANS!!! So yeah, last but definitely not least, I STILL SEE THIS AS A MONSTER, MONSTER TRADE...and the fact that I have been calling this as a top for so long now does not deter me. I HAVE been here before, where the wait for something to happen just went on and on and on...And from that experience, KNOW that it does not mean the trade is not valid. Today's new low close for the past 30 days, I believe, has an extremely high probability of being THE beginning of what I do believe will be a vicious straight down COLLAPSE…With the knowledge that farmers everywhere, hearing the endless drumbeat of “$15-$16 Soybeans are coming,” have not been selling this year’s harvest and are therefore sitting on BILLIONS OF BUSHELS OF SOYBEANS THAT HAVE TO BE SOLD…and with virtually ALL of them holding out, for tax reasons, to sell in the New Year, I firmly believe it is possible that this market can get it going on the downside from RIGHT HERE…which will, believe me, induce more and more selling as it does so…and Soybeans could therefore easily be $2-$3 lower by the time we hit January 1st. I REMAIN WITH AN AGGRESSIVELY SHORT ATTITUDE TOWARDS THIS MARKET AND AM READY TO STEP IT UP IF/AS IT SHOWS ANY FURTHER WEAKNESS FROM HERE. Next week will be interesting. I think every single recommendation here is a great trade…and with the exception of the need for futures in the Stock Indices (which no one will do)… I DO believe that all of these options will minimally hit their halfway objectives…and therefore will make my usual recommendation to do all them in “units” of one option each…or about $10,500 total. Thereafter, if I am dead wrong on all six, you will lose 100% of what you have on the table…And as for what happens if I am partially or completely right, just go back through the charts and do the math yourself. Do contact me if you like any of these ideas…or really, even if you want to disagree. Thanks, Bill 770-425-7241 866-578-1001 All option prices in this newsletter include all fees and commissions. All charts, unless otherwise noted, are by Aspen Graphics and CRB. The author of this piece currently trades for his own account and has a financial interest in the following derivative products mentioned within: All of them |
|