|
Croker-Rhyne Co., Inc. |
|
Main Page |
Philosophy | Current
Recommendations |
Newsletter Archives Contact Us
|
|
|
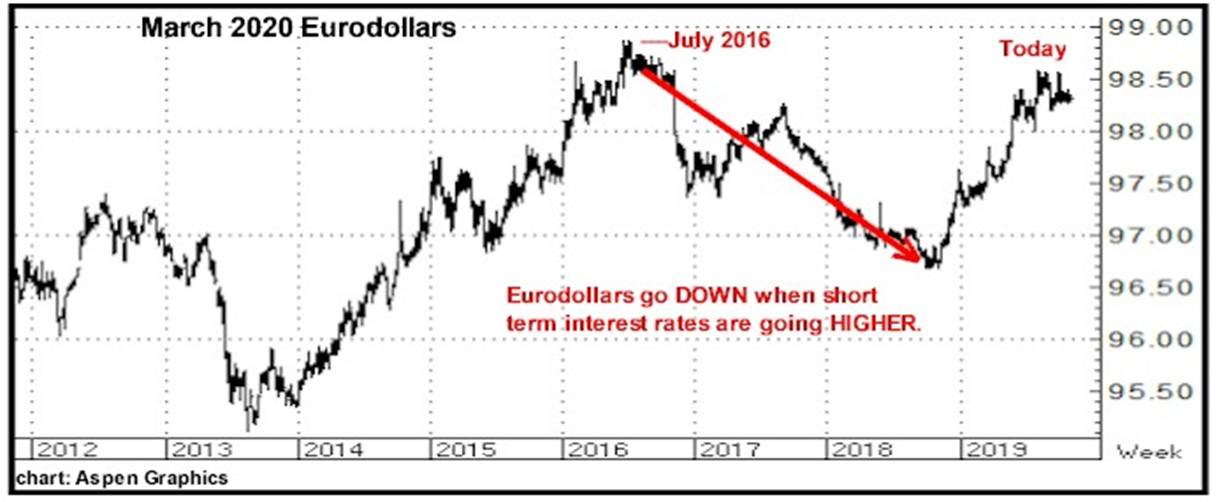
November 11, 2019 In my opinion, the single loudest, seemingly unanimous, theme currently in the financial media is that the USA and World Economies are on shaky, recession-leaning grounds, and that as a result, “rates will be staying low…or even heading lower.” In the course of my four decades in this business, I literally cannot count the times I have seen massive one way opinion turn out to be utterly, totally backwards…and while I may be dead, dead wrong, I firmly believe that this “low rates forever!” rhetoric is just one more classic case of exactly that…I continue to maintain that the USA and World Economies are on the upswing, that the ill effects of the Trade War have been long since been fully accounted for in the markets…and that by the time we get to next Spring, both globally and here in the United States the economic news will have become overwhelming positive. And if my supposition is correct, I can then only believe that all of these ideas about the need for “negative,” or “zero,” or the lowest rates in modern history will have been CONCLUSIVELY discarded as a valid fiscal policy concept. I CONTINUE TO BELIEVE THAT INTEREST RATES ARE HEADING HIGHER AND CONTINUE TO RECOMMEND BEING SHORT TREASURY BONDS AND EURODOLLARS. I have long believed that heavy call option buying can be an excellent indicator that the trading masses have piled into a market, in what oftentimes proves to be a classic “bull trap” that is often seen occurring at the TOP of a market…In other words, after the fact, with the media semi-unanimously touting the idea of, “It’s going even higher!”, the public dives into buying calls for a move that has already happened…i.e., they become sheepherdish heavy buyers precisely when they should be doing the opposite… The chart below provides an excellent example of exactly this having happened 3 years ago, in the Summer of 2016…at the LAST top in Eurodollars…or the LAST LOW in interest rates. The two charts below are of the same time frame (2012 to the present)…and lead me to be even more firmly convinced that interest rates are headed HIGHER…not lower…as we go forward towards the spring of 2020.
To be clear, what you see above is speculators/investors responding to all of the hype about “rates going to zero” and buying call options during the first half of 2016 like there was no tomorrow…therein making the bet that rates would be going to zero or even “negative”…which was followed by rates actually going HIGHER for the next few years, NOT lower, resulting in a mass exodus of calls (expecting lower rates) all the way into 2018…And now? After a 150 point rally in Eurodollars, speculative investors are now, once again, EXTREMELY LONG…once again, betting on even lower rates…And I think they will be wrong...AGAIN. And I will add this: Just because something has happened before in the markets does NOT mean it will happen again…that is…Whatever conclusions I might draw from this historical perspective does NOT mean I will be right…The fact that investors are extremely long does NOT mean that Eurodollars have to go down. Here’s a longer term look at Commitments of Traders in Eurodollars…which also indicates that Speculative investors are quite long this market.
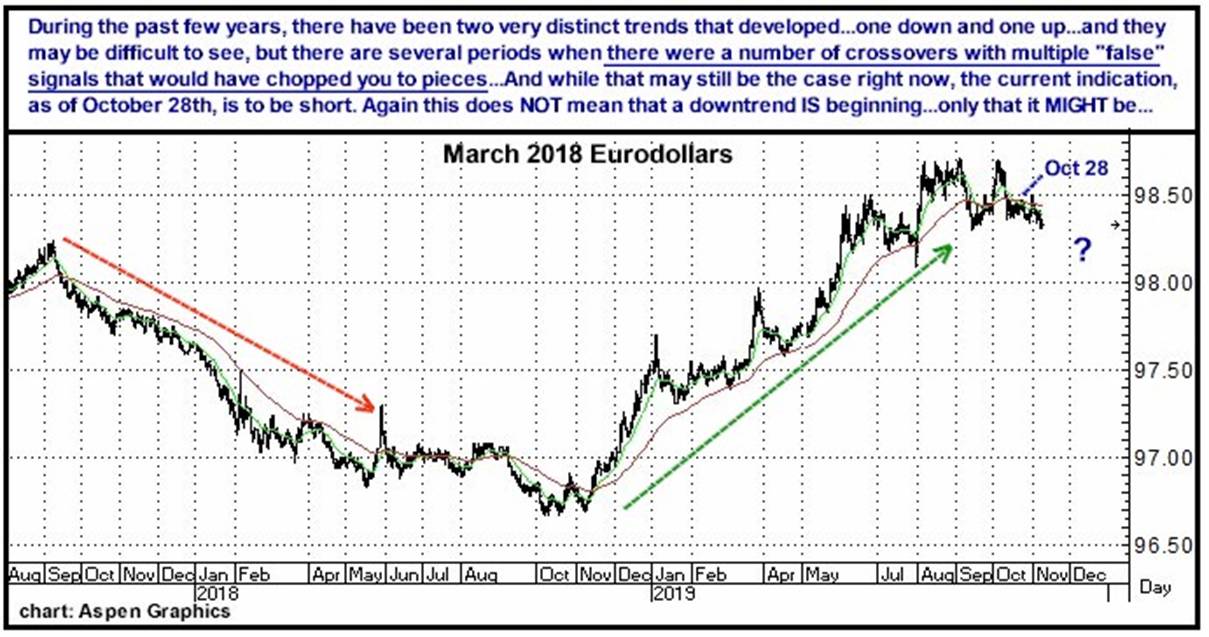
But…to be quite clear…Just because the funds are holding record longs does NOT mean that Eurodollars can’t continue higher…Does NOT mean that my own opinion is correct. And finally, there is this this purely technical indicator that I created and have been following since late 1990’s…and frankly, wish I had been using…not just monitoring. Quite simply, what you see below is a totally mechanical 12 vs 48 day moving average crossover system…which is designed to do one thing: “Identify” and catch medium to longer term trends in short term interest rates as defined by the Eurodollar futures market. As is the case with any mechanical system, it has its pros and cons…in other words IT IS ABSOLUTELY NOT INFALLIBLE…with its major “flaw” being that in a sideways market it can chop you up as it keeps reversing and re-reversing signals to either go long or go short…I would also add that it does NOT predict anything…But what it does do is present a 100% unemotional (strictly mathematical) means to aid in confirming that a definitive trend in Eurodollars may be beginning. Beyond that, as/if that trend does take place, this tool can also be an aid in “confirmng” that the trend is still in force…sometimes for very long periods of time…perhaps allowing you to “sit tight” in a position when you psychologically start thinking, “This thing MUST be stopping here somewhere.” All that being said however, I will reiterate that this is NOT a magic indicator. It is just a tool that I find useful as a trend following guide. What you see below on this 2 year chart of the March 2020 Eurodollar contract: The green line is an average of the last 12 days of closes. The red line is an average of the last 48 days of closes. Because the 12 day average has fewer closes (each new close drops the close from 12 days prior), it changes direction more quickly than the 48 day average (which is adding and dropping 48 closes). Quite simply, when the 12 day (green)crosses below the 48 day (red), this "crossover" indicates that a downtrend may be beginning...and conversely, when the 12 day crosses above the 48, the indication is just the opposite.
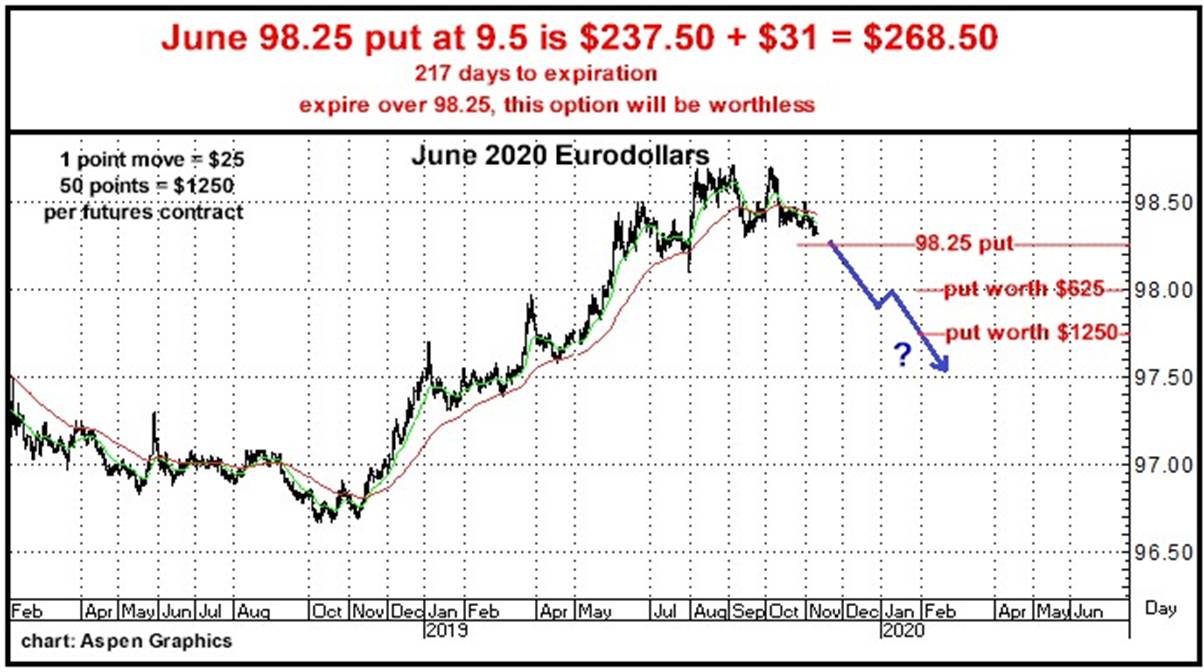
Enough said…In spite of the seeming mountain of analysts and media opinion arguing the opposite, I believe that the next 3-6 months will see better…and better…and better news on the economic and trade fronts…and the end result, in my opinion, will be that both short term and long term rates…6-9 months from now…will be substantively higher…and both Eurodollars and Treasury Bonds will be much lower. These are options I like at current levels…
And I would point out that the CURRENT rate for LIBOR (which this contract is based on) is 1.9%...or the equivalent of 98.10 on this chart…Importantly, what this means is, that if rates do not change, at all, between now and next June, this contract would go off at 98.10…And if rates go up 1/4% by next June, this contract would go off at about 97.85…And obviously, if am wrong and rates do go 1/4% lower (from current levels), this contract would go off at about 98.35 (about where it already is today). And the Bonds…
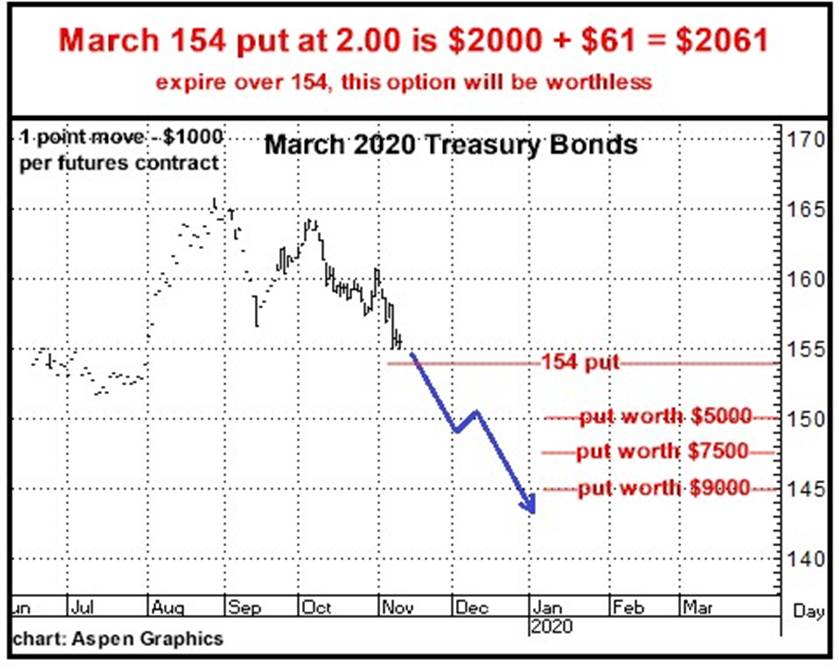
Here’s the big picture in Bonds…
Give me a call if you want to talk about anything here…or just say hello. Thanks, Bill 866-578-1001 770-425-7241 All option prices in this newsletter include all fees and commissions. The author of this piece currently trades for his own account and has a financial interest in the following derivative products mentioned within: Eurodollars, Treasury Bonds |
|