|
Croker-Rhyne Co., Inc. |
|
Main Page |
Philosophy | Current
Recommendations |
Newsletter Archives Contact Us
|
|
|
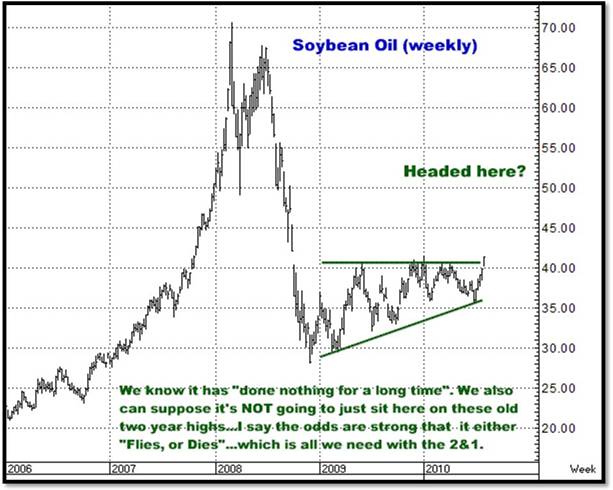
August 4, 2010 For any of you who put any faith at all in chart patterns, the chart below IS about as classic a flat top (ascending) triangle as you will ever find… Additionally, per the following two paragraphs from my website, where I have outlined my basic approach to trading and the use of the Both Sides Strategy (the “2&1”), it should be obvious that the current look in Soybean Oil is EXACTLY the situation I described as the “perfect” set up…some 15 years ago. Select markets which have done nothing for a long time. If a market has been trading sideways for quite some time, probabilities "should be" (anything is possible in the futures markets) better it is soon going to move somewhere. Long sideways move are often followed by large directional moves. Or select markets at price levels at which you can make the statement, " It will not stay here, and, in fact, should move a long way from here, one way or the other". As an example, you might look at a market making the same high for the fifth or six time in six months and say, "I don't know which way it's going, but it's not going to be right here six months from now". Obviously, it could be, but, again, probabilities "should" favor it moving away from this old high, and this move could be either substantially up, or down.
Give me a ring if you’re interested…Calls are anywhere from $750 to $1250; 2 & 1’s from $3000 to $4000. Thanks, Bill 866-578-1001 |
|