|
Croker-Rhyne Co., Inc. |
|
Main Page |
Philosophy | Current
Recommendations |
Newsletter Archives Contact Us
|
|
|
April 21, 2022 Why you DO need to be there NOW… Short CORN AT ITS HIGHEST PRICES EVER…
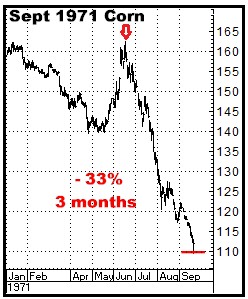
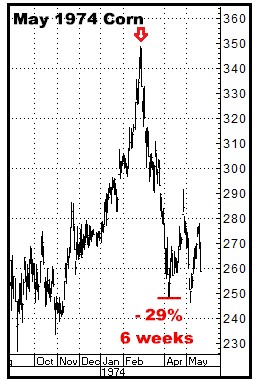
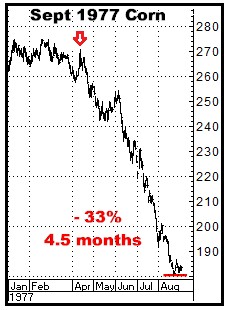
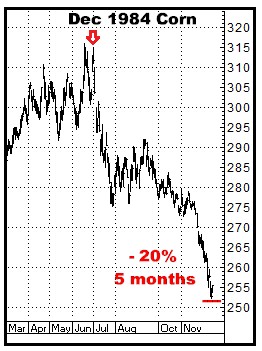
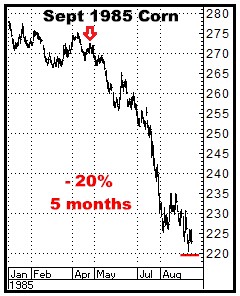
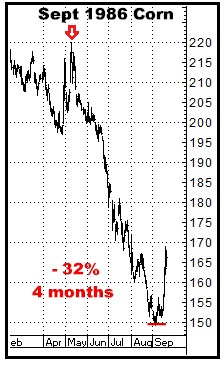
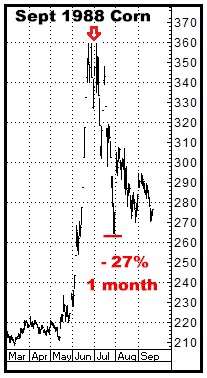
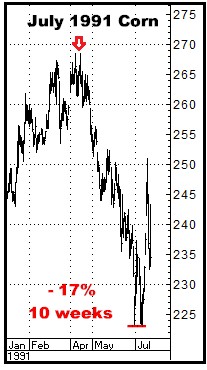
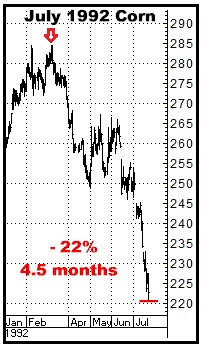
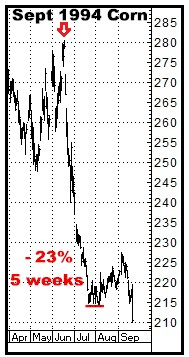
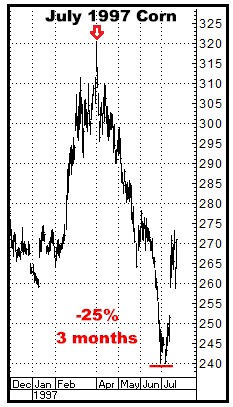
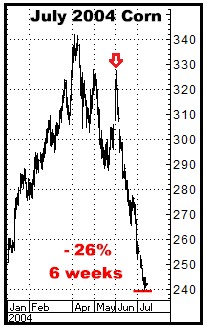
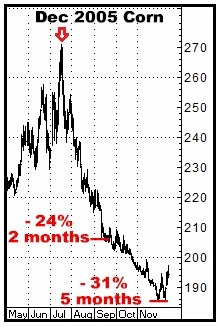
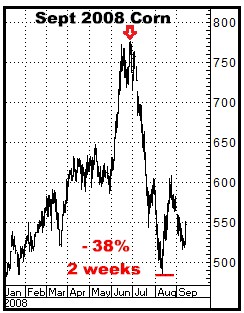
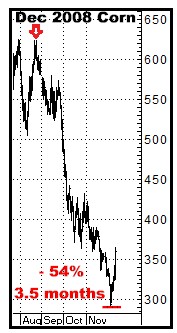
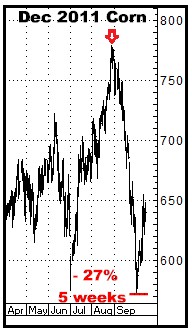
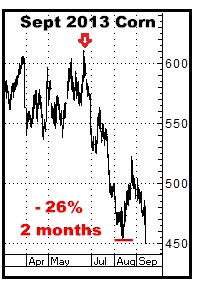
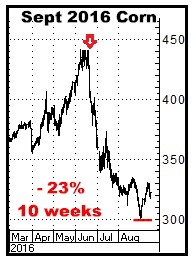
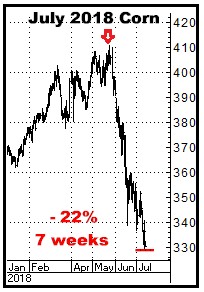
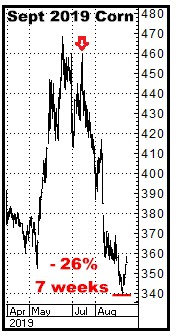
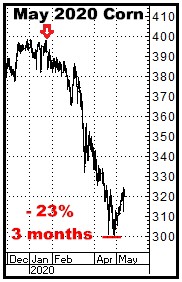
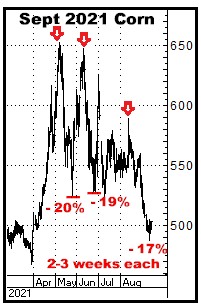
This will mostly just be charts, statistics and observations of how Corn has topped out for the past 50 years. I would suggest you note the following as you at least skim through the FACTS that are included here: #1 Corn has a decided “V” market tendency when it tops…that is, it frequently goes, literally overnight, from having traded straight up…to then GOING STRAIGHT DOWN…again, literally from one day to the next. And to verify that, further below I have again provided 44 chart snapshots of how that has REPEATEDLY been the case during the past 50 years. #2 When Corn tops out, far more frequently than not, it drops 25-30% ($2.00-$2.40 in today’s values) within the next 6-10 weeks. #3 AND MORE IMPORTANTLY…Every top starts with just one down day…And, in Corn, if you are not Short before the move down starts, the odds are EXTREMELY high that within just a few days, you’ll find yourself trying to figure out how to get on a market that has ALREADY dropped 4-5%...the FACT of which is substantiated in table below. Going back to 2000, encompassing 25 Corn market tops, or significant declines, here is a look at how BIG those sell offs became WITHIN THE FIRST 4 DAYS OF THEIR HIGH TICK… How Corn STARTS a decline (makes its high, then how much it falls within 4 days as it starts what then becomes a major decline)
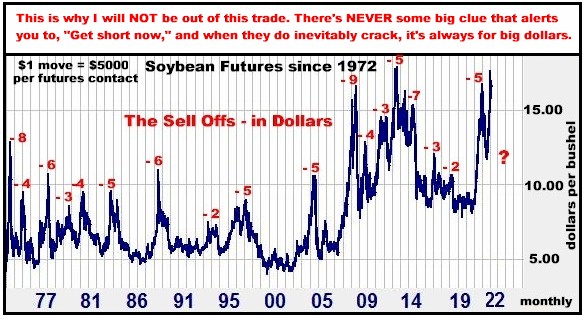
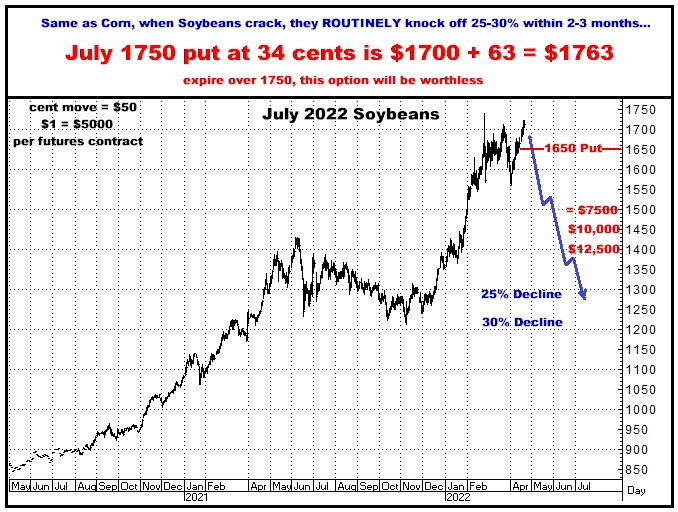
Summarized? WHEN CORN IS BEGINNING A MAJOR DECLINE, IT BLASTS OUT OF THE GATE, FROM DAY ONE, AVERAGING A DECLINE OF 40 CENTS IN JUST 3-4 DAYS…WHICH ABSOLUTELY INDICATES YOU NEED TO BE THERE BEFORE THE MOVE STARTS. And if you’re not there ahead of time? Three or four days into the move, with Corn already down 40-50 cents, and grabbing everybody’s attention, you’ll be wanting to get Short but wondering, “Where do I do it? Wait for a rally? Dive in now?”, not to mention that options obviously will have jumped massively in value by then…which is why it simply makes sense to buy puts here, and if you’re early, so be it. Again, as I also keep repeating, there is NOT going to be some signal, or event, or comment that tells you, or anybody, that the Bull market has accounted for ALL the bullish news…and HAS ENDED. That ain’t the way this mob psychology game works… And here, again, are all those 50 years of examples verifying that the Corn market DOES frequently stop on a dime…and basically collapse 25-30% within 2-3 months…And yes, one MORE time, with ZERO news to signal that the top has been made.
So, one more time, ask yourself if you think ANY of these sell offs were predicted or if ANY of them were preceded by some “signal” or event that said, “Get Short Now. The market is immediately about to drop 25% in the next month or two,” even though that IS obviously the way it happens, year after year after year. How to get short here… Believe me, I am fully aware of all of the latest bullish “logic” out there in Corn right now….that high fertilizer prices are reducing acreage, or that weather might delay planting the second Corn crop in Brazil, and obviously everything about Ukraine, and of course all the talk about what our own weather might be, and so on and so on…but so does EVERYBODY…Everybody knows ALL of that and so does the FUTURES market, such that I firmly believe THE MARKET HAS ALREADY INCORPORATED ALL OF THOSE BULLISH “KNOWNS” INTO PRICES…WHICH IS WHY THE MARKET WENT TO $8.00…BUT…where it will be 2-3 months from now is a totally different story.
THIS MARKET IS A SHORT. HERE AND NOW…
Yes, I have been wrong, but DO THIS NOW…OR…DO THIS AGAIN… AND ditto all of the above for Soybeans…I will NOT be out of either of these two markets...or as I told one farmer this morning, “I WILL be short $8.00 Corn and $17.00 Soybeans. And I will NOT be out of this trade. This IS a rare opportunity and the potential is too big to miss…And I don’t give a sh*t how bullish every analyst I see is. To me, these two markets have nowhere to go but down…and think they will go down BIG…just like they always eventually do. When it’s over with them, it’s OVER.” And I absolutely believe that.
I look for big trades with big potential. Doesn’t mean I will be right, but I honestly don’t think it gets any bigger than this…that these two markets represent the biggest 1-2 punch EVER in the agricultural markets. So, my recommendation is to do them both as a “unit”…totaling $2876. Call me if you want to know more…Lots of ways to go about this… Thanks, Bill 770-425-7241 866-578-1001
All option prices in this newsletter include all fees and commissions. All charts, unless otherwise noted, are by Aspen Graphics and CRB. The author of this piece currently trades for his own account and has a financial interest in the following derivative products mentioned within: Corn, Soybeans
|
|