|
Croker-Rhyne Co., Inc. |
|
Main Page |
Philosophy | Current
Recommendations |
Newsletter Archives Contact Us
|
|
|
June 11, 2021 Why I am now aggressively short Corn…and will STAY SHORT CORN… And why I look for at least 25% on the downside from here WITHIN THE NEXT FEW MONTHS There are 41 charts below of how the Corn market has gone down for the past 50 years. I’ve put them in a form with the intention of this being a fairly quick, and easy, study for you…detailing WHEN Corn went down, by HOW MUCH, and HOW FAST it did so…such that you can see what I see…and then understand why I am “aggressively short.” There are many variations on how these declines occurred but the bottom line (and IT HAS BEEN HAPPENING, REPEATEDLY, FOR 50 YEARS) is when the Corn market goes down, it really is, ROUTINELY, ALMOST STRAIGHT DOWN. As will be obvious as you scroll through the charts, Corn also has a DECIDED tendency (a major understatement) to move sharply lower between June & August. I would also suggest that you note that there are NUMEROUS occasions where sharp weather, or news related, rallies were occurring during the summer…wherein Corn was making new highs and looking like a rocket…but then just DIED…and went relatively STRAIGHT down…again, on NUMEROUS occasions…And to KNOW, that at those highs, there may have been 2 analysts out of 100 who would have been saying, “Wake up people! Corn will be down 20-25% with the next 60 days.” And maybe not even 2 analysts…because that is the way this game works…THAT IS THE WAY THE MARKETS WORK…To the extent that I will even say that I have NEVER seen a market top, in anything, where you had a whole herd of analysts and traders saying, “Ok. That’s it. Time to get short.” NEVER. NEVER. NEVER. And right now…There must be a few out there, but I have yet to see the first “expert” who is anything but bullish Corn (and Soybeans). HAVE YOU? After buying these markets a year ago (when the whole analytic world was bearish) I have been looking for a top for some months now…and have been wrong (and not for the first time). Nevertheless, MY VERY STRONG OPINION HAS BECOME THAT THE CORN AND SOYBEAN BULL MARKETS ARE LIKELY OVER, for a LONG time and if you are a farmer, I think you should be hedging a decent percentage of your anticipated production in both the 2021 and 2022 crop years…I know there is all sorts of rhetoric from analysts about how, “No matter how much production there is this year and next, stocks are going to tight…and prices will stay high for the next few years,” but I don’t buy it…as I have seen that RECURRING story, following bull markets, proven wrong too many times to count since I got into this dumbass business in 1980. Enough talk. What I want you to do is TAKE THE TIME TO BROWSE THROUGH ALL THESE HISTORIES…and then decide whether you think the outcome of today’s markets should be any different that all of the real world evidence that you see here.
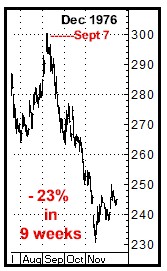
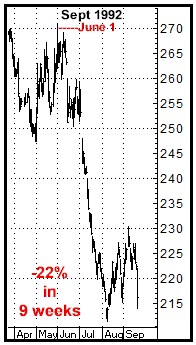
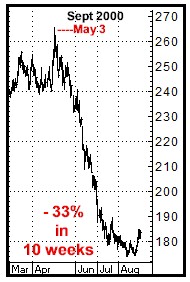
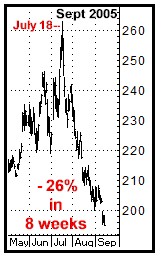
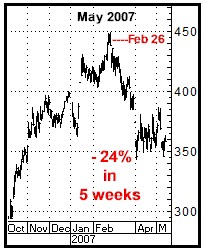
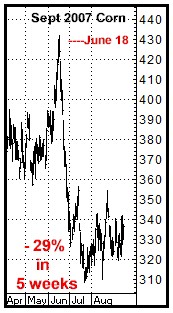
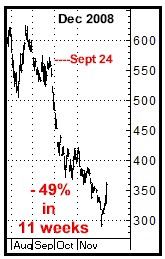
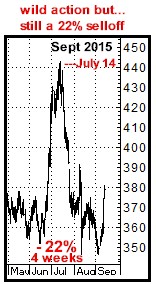
And DO note when the declines began, how big they were, and how long they took…Also observe that, time after time after time, Corn was often rallying hard, on some “bullish” news…RIGHT BEFORE IT TURNED AND WENT STRAIGHT DOWN…
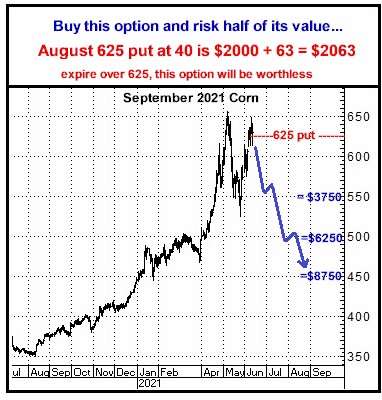
My observations? I haven’t run the numbers, but I’m going to say that the average decline is easily somewhere in the 25% range…and the time frame to do so is about 8 weeks…Also that there are OBVIOUSLY A LOT OF DECLINES THAT STARTED JUST ABOUT NOW. With all of this in mind, and with the extreme degrees of volatility we are seeing across the board in the markets, I will say that I SEE A 25% SELL OFF AS A MINIMUM OBJECTIVE…WHICH TRANSLATES TO ABOUT THE $4.90 LEVEL IN SEPTEMBER CORN. Today’s market…Compare this to what you see in those 41 histories above…
The long term picture… Buy low. Sell HIGH?
HOW TO GET SHORT… Here’s one way to go…And per the strength and confidence in my opinion, I AM ALSO DOING FUTURES HERE…If this is your preference, I can outline the MECHANICAL approach I am using to do so…And there are a number of different option possibilities as well…
As always, I might be dead wrong about this…but these ARE the best historicals I have ever seen pertaining to a specific trade…In reality, as I sat here going through these charts year by year for the past few days, I asked myself, “Why in the hell haven’t you noticed this before?” At any rate, the only thing I am concentrating on now is what is the best way to do this…and beyond that, how to just STAY on the short side for the next few months if/as this market COLLAPSES. It absolutely does not mean I will be right but I could easily say I am more confident…and OBJECTIVELY so…about this trade than I have been about any idea in years. But I urge you to not let that sort of statement scare you…and I also urge you to NOT think, “He’s just been nothing but wrong lately. I’m not spending a dime on this.” I get this stuff wrong. And I get it right…And every now and then something big does come along, that, when you get down to it, is undeniable from a probability standpoint…And the reminder on my wall is dead on true: ONE GOOD TRADE IS ALL IT TAKES...and I think this is absolutely one of them. And lastly, if you think getting short makes sense, DON’T think, “Oh, I’ll just figure out exactly the right time to do this,” or “I’ll know when it’s starting.” You don’t get cute. You just do this. You own puts, or get short futures, here and now…And if nothing HAS happened a month from now…YOU GET SOME MORE. And btw…This is a ditto for Soybeans…And also, if Corn is going down, I think the Feeders will be going massively in the opposite direction… Thanks, Bill 770-425-7241 866-578-1001 All option prices in this newsletter include all fees and commissions. All charts, unless otherwise noted, are by Aspen Graphics and CRB. The author of this piece currently trades for his own account and has a financial interest in the following derivative products mentioned within: Corn, Soybeans, Feeder Cattle |
|