|
Croker-Rhyne Co., Inc. |
|
Main Page |
Philosophy | Current
Recommendations |
Newsletter Archives Contact Us
|
|
|
January 27, 2020
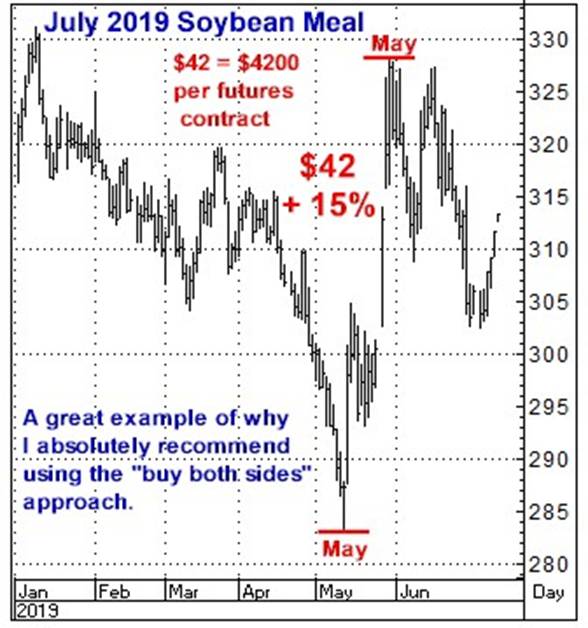
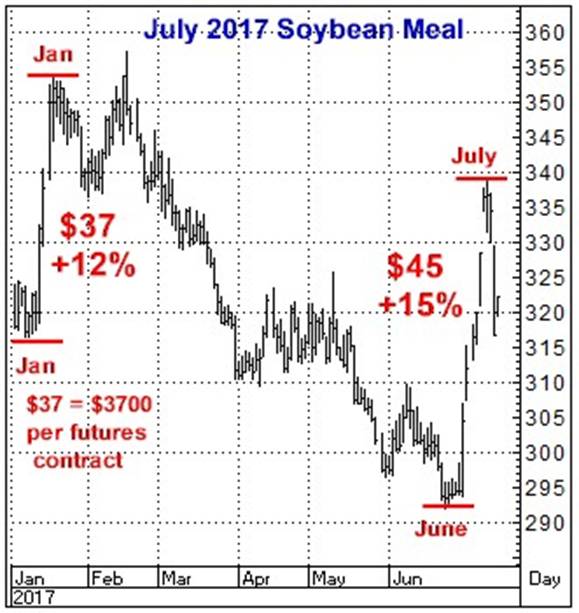
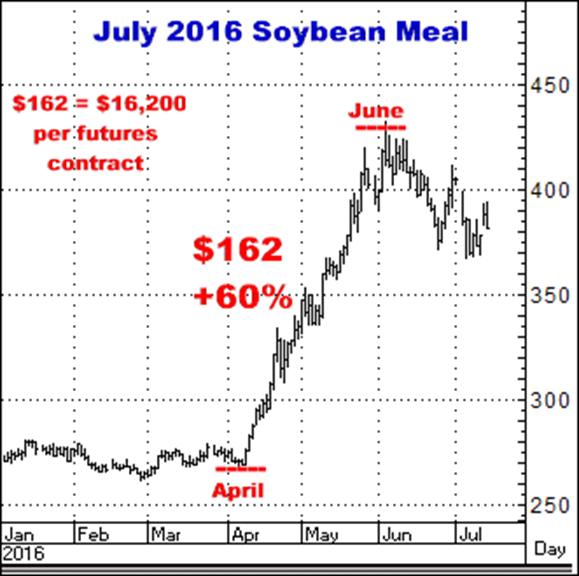
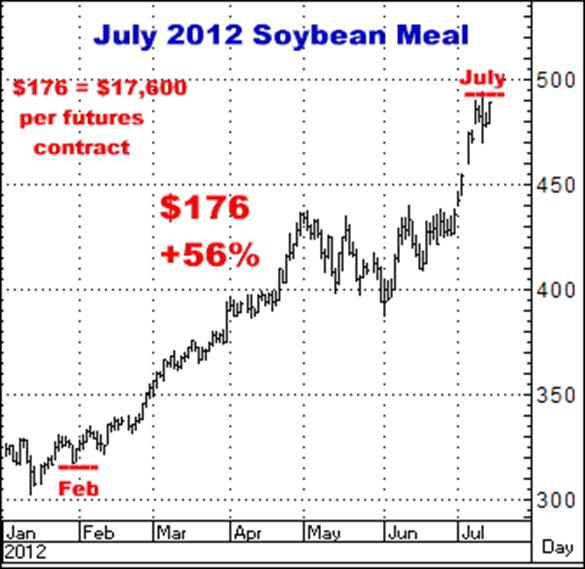
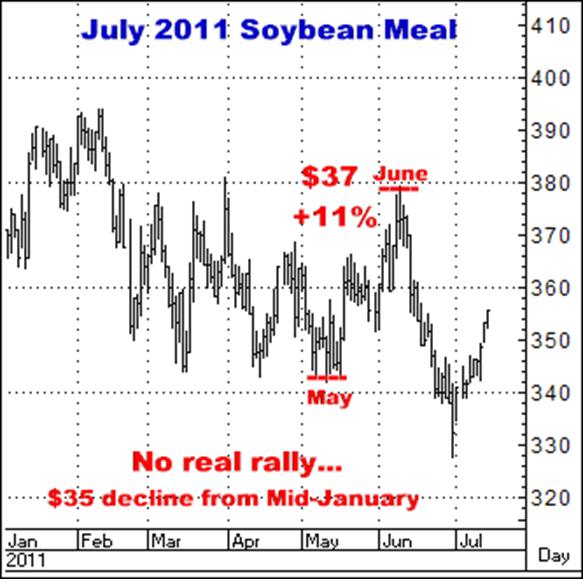
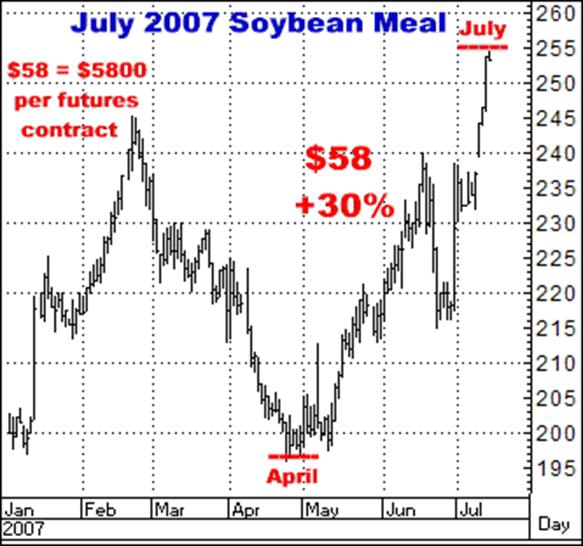
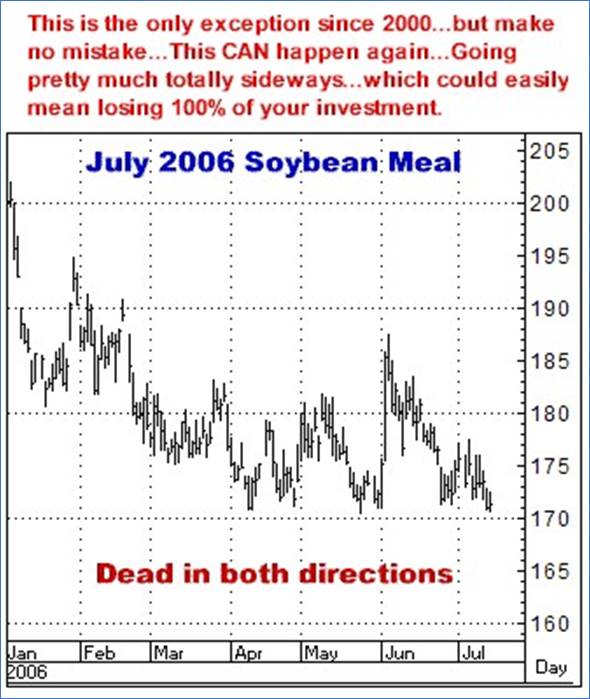
I have long believed that my opinion about the markets is not anywhere near as important as the math of how option prices can change, both positively and negatively…and this trade, I believe, drives that point home…more so than just about anything I have ever seen in this business. Same as I wrote the first time I made this recommendation back in early 2017…This is a trade I think I will take for every year for the rest of my trading life… My general opinion coming into 2020 has been, and is, that this year will ultimately be nothing but bullish for the USA’s main four row crops (Corn, Cotton, Soybeans and Wheat)…and for several months I have been looking at how to take those positions, pretty much coming to the conclusion (as I did last year as well) that the smart thing to do is simply buy summer dated calls in each one of them…and basically own all four markets as a single unit. Thereafter, by the math, one can assume that if just one of these markets has a solid bull move, and the three others totally die, there is an excellent possibility you could still come out with a net profit…And more optimistically, if 2, 3 or all 4 had the types of moves that I am expecting, you obviously could be looking at very attractive profits…Conversely, of course, if all four go wrong, you could lose every dollar you have invested…that is, you could lose 100% of what you put on the table. But…Past experience has taught me that no matter how many times I present this sort of diversified “Buy all four” strategy, very few people ever do so…with the question I most frequently get being, “Which one do you like the most?” So, with this in mind, I’ll go straight to the single market that I think has the best odds, leverage and potential… AND I FIRMLY RECOMMEND DOING THIS USING THE “1 & 1” STRATEGY, (OUTLINED WHEN I GET TO ACTUAL OPTIONS PRICES) PER THE HISTORICAL DATA INCLUDED BELOW, THE MATH, TO ME, IS UNDENIABLE. USING the 1 & 1 (1 call & 1 put) I AM BUYING JULY 2020 SOYBEAN MEAL The bottom line, as you should be clearly able to see with both the individual charts…and summary table…is that MUCH more often than not, Soybean Meal (feed for livestock) has had what I would classify as a fairly sizable rally, at some point, between now and the contract’s end in early July…And I firmly believe the “1 & 1” (units of 1 call and 1 put) is the perfect strategy to definitely increase the odds of catching that rally, when, and of course, IF, it does occur… The first thing, to get some idea of what possibly might happen, is to observe what this market has done for the past 19 years…So, What follows is every July Soybean Meal contract going back to 2000 (19 contracts) between mid-January and this contracts July expiration. On each chart I have noted whatever rallies have taken place from mid-January forward…how big they were in Dollars, how big the move was in percentage terms, as well as the months in which the moves began and ended. I will preface this historical data, however, by stating that anything that has happened during these past 19 years does NOT mean it will happen again… That being said, my purely factual observation is that this market has had a DECIDED tendency to put up a strong rally between now and summer…and the moves are often quite direct…and NOT small. But I will again offer that these histories do not mean it will be the case in this year. EVERY $1 MOVE IN SOYBEAN MEAL = $100 PER FUTURES CONTRACT – OR – EVERY $10 M0VE = $1000 PER FUTURES CONTRACT So, note the size of the moves, when they began and ended…and how they actually did make the bull move…which, as previously noted, is often relatively straight up…
All charts in this study were created using Aspen Graphics And yes, there are some big dollar moves here…which, aside from the high percentage number of years this market has had a strong rally, is one of the factors that definitely attracts me to this trade. Here is a summation of what you see on those chart histories…And with today’s values for virtually all commodities being notably higher than they were a decade ago, to me, the most important statistic here is HOW BIG THE PERCENTAGE MOVE WAS IN EACH OF THESE CONTRACTS… Rallies in July Soybean Meal Mid-Jan to Expiration
DOES 380 look like a big move from here? And for what it’s worth, I don’t think the current market “angst” about Coronavirus is anywhere near as serious an issue as the Information Age Media is billing it as (everything seems to be touted as a “crisis”). Maybe it will affect some aspects of China’s or the World’s economies (like tourism or air travel for example…and temporarily…This is not Ebola), but I DON’T think it going to affect the quantity of Soybean Meal consumed by the world’s livestock population. Period. I don’t. Maybe I’m dead wrong but just don’t see that. Here are the options I would recommend at today’s levels…
Again…I urge you to just look at the numbers…At what has been the tendency for this market going back to 2000 (and further really)…And how the math of these options prices do work out…whether we go up, down, or sideways. Call me if you want to talk about it. Thanks, Bill 770-425-7241 All option prices in this newsletter include all fees and commissions. FUTURES TRADING IS NOT FOR EVERYONE. THE RISK OF LOSS IN TRADING CAN BE SUBSTANTIAL. THEREFORE, CAREFULLY CONSIDER WHETHER SUCH TRADING IS SUITABLE FOR YOU IN LIGHT OF YOUR FINANCIAL CONDITION. PAST PERFORMANCE IS NOT INDICATIVE OF FUTURE RESULTS. THERE IS NO GUARANTEE YOUR TRADING EXPERIENCE WILL BE SIMILAR TO PAST PERFORMANCE. The author of this piece currently trades for his own account and has a financial interest in the following derivative products mentioned within: Soybean Meal
|
|